


Effortlessly Manage Your Data Pipelines with New Activities Page

New Activities page: more transparency over your data operations
Instantly drill down and take action on your data operations in a few clicks or programmatically with the rollout of our fully redesigned Activities page.
If you manage a data team or spend most of your time trying to move and integrate data at scale, you know how tricky it is to quickly locate data pipeline activity. With the growing volume of data pipelines, it’s crucial to gain transparency and clarity of your most relevant data pipeline activity.
To help you achieve that, we’ve just rolled out a fully redesigned Activities page. The newly enhanced intuitive Activity page lets you monitor and track all your data pipelines, from what’s currently running to its exact credit usage. Now you can easily focus and manage your most important data pipelines faster.
The Activities page includes the following elements:
- Intuitive drill-down capability to view all data pipeline executions from top to bottom
- Ability to trigger a River rerun directly from the page
- Total transparency of RPU consumption for different activities
- Access to all of the above via API as well
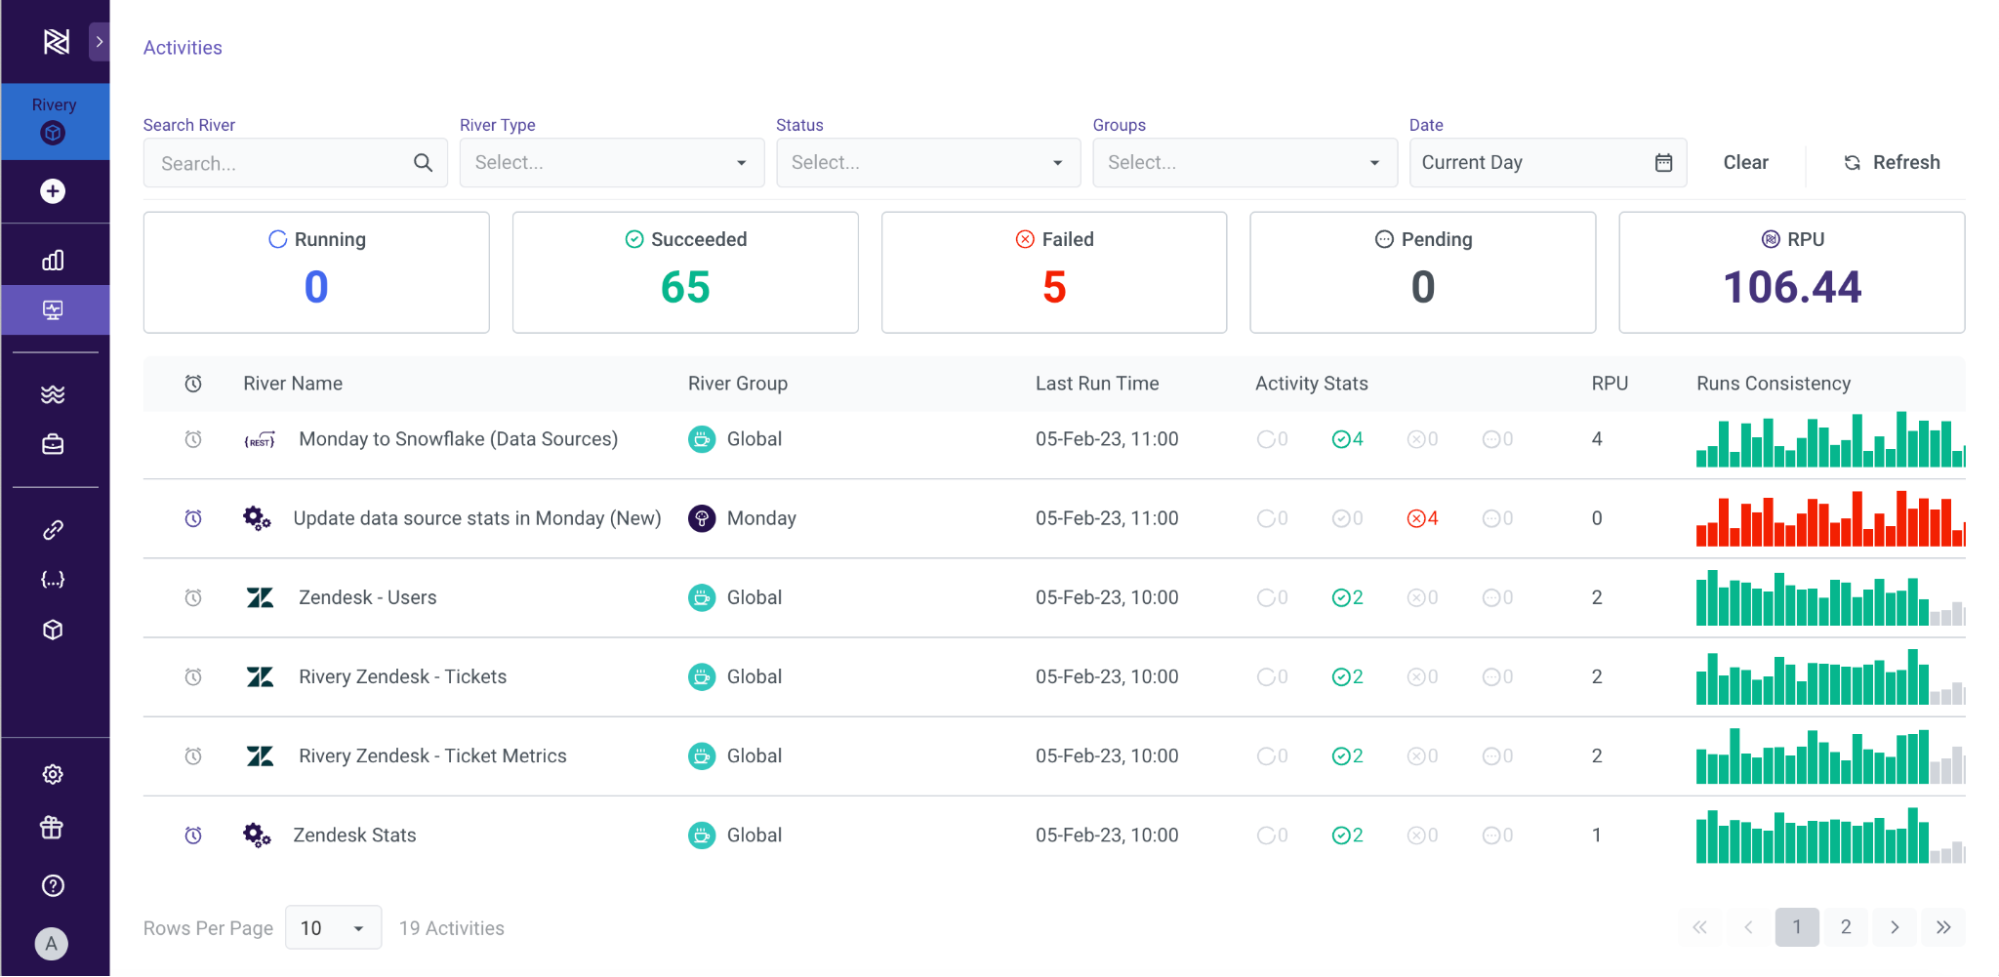
New Activities page interface
Top 4 benefits of the new Activities page
1. Zoom into the details you need faster
With so many data pipeline (River) runs, sometimes in a single day, it can be hard to find the ones that need special attention. The new Activities page experience allows you to quickly zoom into specific Rivers using intuitive filters or sorting abilities. This can save you valuable time if you want to focus only on failing Rivers within a certain group of Rivers or to analyze Rivers with high RPU consumption even further..
Once you identified the Rivers to analyze, simply click on the River to drill into all of the executions of that specific River and select the run you want to analyze:
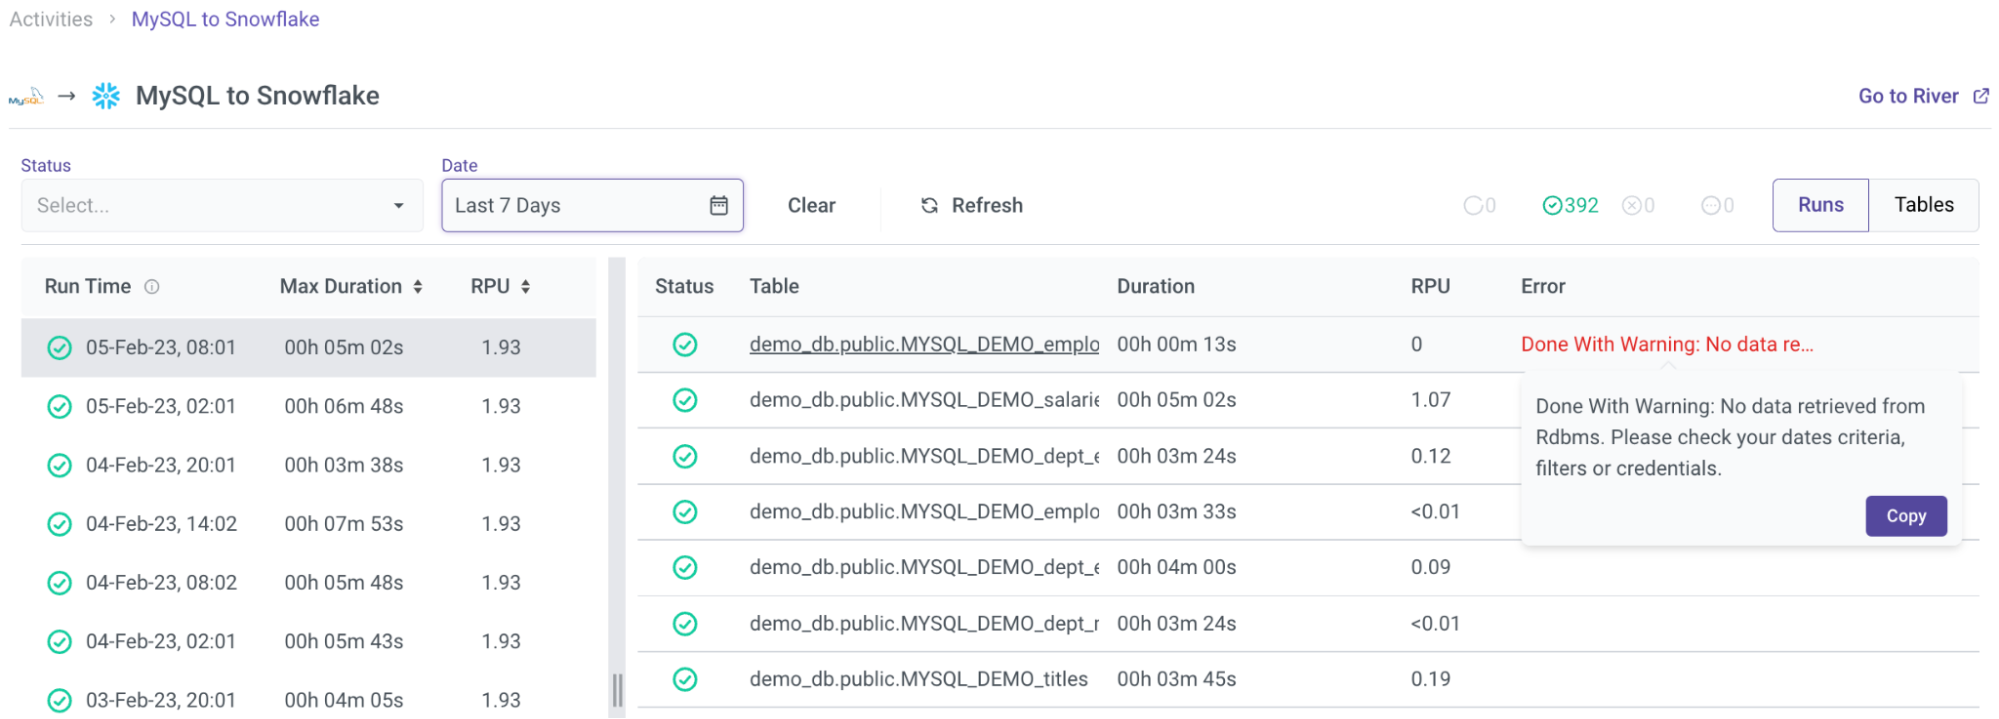
Drill down view of a specific River run
While we all want data pipelines that are “set and forget”, experienced data engineers will tell you that one thing is certain, and that is change. And change requires some adjustment on your end in how you manage your data pipelines. While Rivery eliminates all of the work required to manage schema drift changes, there are still changes that may require your involvement (i.e. data source API credentials changes). Gaining full transparency and getting the details of what’s going on can make your life much easier.
This is especially true, when looking at advanced Rivers (i.e. logic Rivers) that contain multiple steps in the data workflow. Analyzing such River behavior is much simple with the new interface where you can visually see individual steps within the logic Rivers and identify the exact failing point:
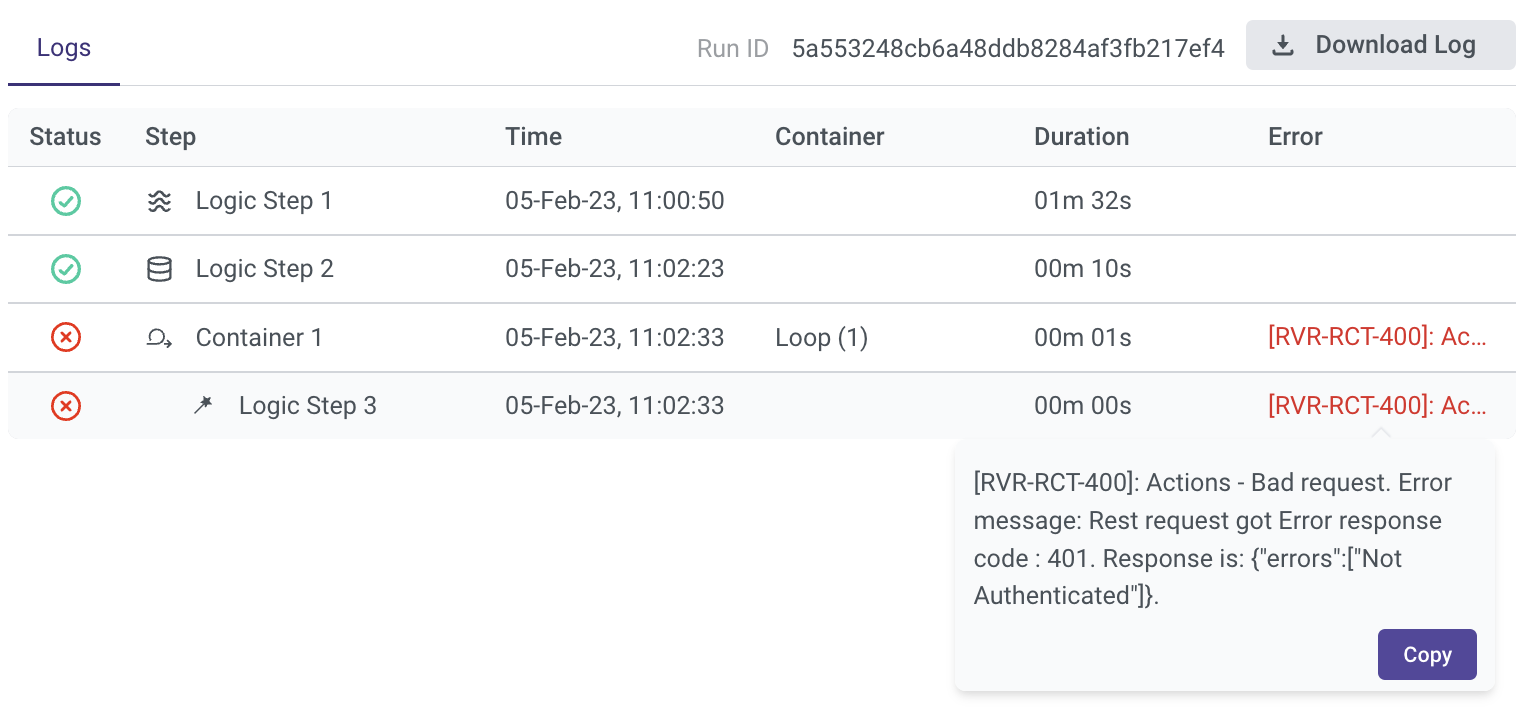
Logic River individual steps
Here you can quickly see the first two steps in the logic River were successful. The failure is due to a bad authentication on the third step which happens to run in a loop within a container. From there, you can drill even deeper into the specific step details or download the log for further analysis.
2. Take action right then and there
Finding failures is the starting point of your analysis but the next step is correcting those. Sometimes, all you need is a simple rerun of your River as the conditions that caused the original failure are no longer pausing an issue.
To rerun your River, all you need to do is click the new “Retry” button which is available next to each failed run in your list of runs.
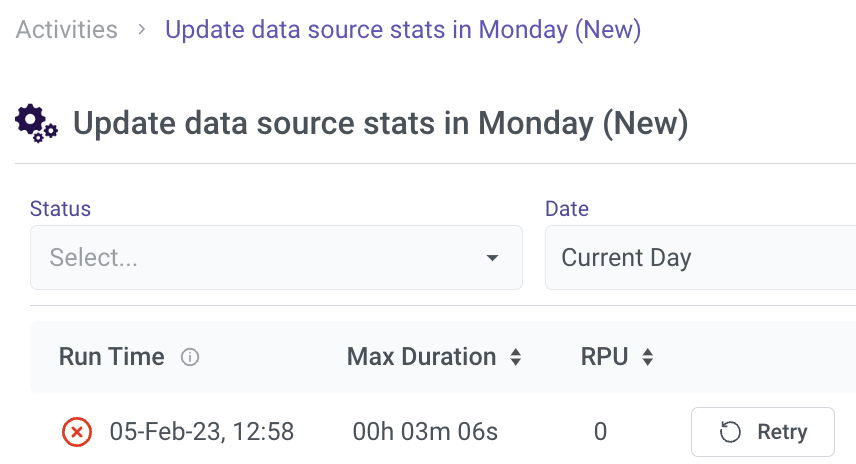
“Retry” option for failed River runs
If you need deeper analysis or to perform actual changes within your River, you can also use the “Go to River” link to navigate directly to your River.
3. Understand your consumption
With the current macroeconomic conditions, understanding your cloud costs and finding optimization opportunities is key to running a successful data operation. The rise of FinOps makes more sense than ever. If you are new to the concept, here’s a quick intro to it: FinOps is a cloud management discipline that enables organizations to get maximum business value from the cloud by helping technology, finance, and business teams to collaborate on data-driven spending decisions.
It’s our mission to provide the necessary tools for FinOps support. This includes capabilities that enable data and analytics leaders to iteratively control spending, understand product performance and make choices regarding price-to-performance trade-offs, resulting in an optimal allocation of resources in the cloud.
The new Activities experience provides RPU consumption details both at the aggregated level as well as at the specific River run level. Stay tuned, for additional capabilities in this regard to be released in the coming weeks.
4 Automate your operations
All of the above options are also available via the Activities API. This allows you to integrate data from Activities with other systems in your organization or to automate certain actions (i.e. trigger a River execution) based on different scenarios.
Ready to get proactive about your data pipeline activity?
We hope you’ll enjoy the new Activities page experience. It’s designed to give you more transparency into your data operations. Start controlling every activity that matters with full clarity, whether it’s pipeline executions, error handling, logging, or consumption.

Minimize the firefighting. Maximize ROI on pipelines.