


Ready-to-use toolbox to prove your ROI with RetailTech solutions

Editors Note: This article was written in collaboration with Yehuda Avitzur, CEO of Raven Data.
The latest industry insights from Cascadia Capital suggest that the Retail Tech market is expected to reach $47.8 billion by 2030, demonstrating a remarkable 12.2% compound annual growth rate (CAGR). This exponential growth is fueled by rapid digital and automation advancements, which are transforming various aspects of retail operations in both physical and online stores.
But, behind the glitz and the glamor of this tech-driven revolution lies a fundamental challenge:
How do retailers achieve this type of growth through a retail technology product by utilizing existing data?
Our team partnered up with Raven Data to put together a framework to prove your product’s ROI through existing data which can be applicable during both sales and routine operations.
Challenges in RetailTech
Retailers are experts in understanding the most effective sales strategies, knowing what their customers want to purchase, and identifying the optimal ways to increase profits.
Both brick-and-mortar and e-commerce retailers possess the capabilities to boost sales independently, whether it’s through special deals or intuitive decisions.
The majority recognize the importance of leveraging tech tools to enhance their revenue, yet the market is flooded with such options. Ultimately, retailers focus on one question: Will the profits surpass the investment costs?
Many retail tech companies naturally focus on the development and construction of their products. When it involves building a physical product, the complexity can be significantly challenging. These companies often neglect data analysis capabilities during the early stages of company and product development, considering it a ‘nice-to-have’ rather than a core capability essential for proving the product’s value and generating sales—until it’s almost too late.
If you get to the heart of it, one of the main reasons organizations don’t perform data analysis within the B2B2C vertical, and more specifically in RetailTech is the complexity of performing this analysis which consists of numerous layers.
This leaves questions to go unanswered like:
- An end-user looking to view their purchase history
- The store manager aims to understand the product’s performance and operation in their store
- The chain manager looking to assess the returns on their product investment
- The retail-tech company itself looking to improve and develop its best features
It’s challenging to truly be data-driven if you’re not leveraging data to address critical questions like the ones mentioned above. As the world increasingly adopts AI capabilities, we find ourselves amidst a whirlwind of complexity. While AI makes data integration easier, without a proper strategy to utilize data and demonstrate ROI, the essence of being data-driven is lost.
Successfully navigating this landscape requires extensive experience in integrating data and retail. It begins with crafting a strategy tailored to address the unique pain points for your retail company, such as a lack of perceived value or understanding among stakeholders. From there, it’s crucial to establish the right data infrastructure capable of meeting diverse needs across the retail spectrum.
A Better Way Forward
Fortunately, there is a tried and tested way to demonstrate ROI. The solution can be broken down into two areas, business logic and the technical mechanics behind the scenes.
- Business Logic: Leveraging customers’ usage of your product to generate numerical evidence that the product boosts main metrics for retailers. Through an accurate understanding of the retailer’s improvement goals and evidence of this through the usage of your product, retailers will see how your product boosts their outcomes. This approach enables you to create analytics and predictive models based on your data, incorporating them into your current solution as embedded analytics.
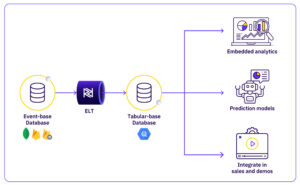
- The technical mechanics behind the scenes: The primary concept centers on identifying specific data sources and, within those, finding relevant datasets that meet the intended purpose. These datasets are then converted into a uniform tabular format suitable for analytical data infrastructure. After establishing this, the next step is to develop a precise algorithmic solution and Visualize it.
The technical process is carried out as follows:
Characterizing the required data – Delving deeper into the data touch points and from there focusing on precisely defining the scope and nature of the data needed to solve this challenge.
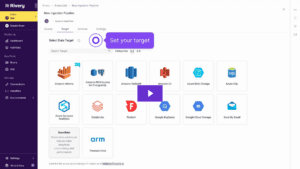
Bringing the data from various systems – Gathering information from various sources, such as app databases like MongoDB or Firestore (common NoSQL databases for Retail use cases), CDP platforms, GA4, and other user touchpoints.
After collecting those sources, conduct ELT processes using Rivery. Handling this type of data is complex as it requires careful consideration of schema flexibility, nested document structures, scalability, and ensuring data consistency due to its schema-less nature and JSON-like document structure.
Rivery offers a user-friendly interface that simplifies the process of designing, deploying, and orchestrating data pipelines.
Opening a dedicated cloud environment of a trust center – To enable smooth collaboration and secure data management, a dedicated cloud environment is established in Google Cloud to provide a strong infrastructure for data storage, access, processing, and management, and serve as the host for the data delivered to downstream systems after the ELT.
Building unifying tables of the data in the Cloud – after having the data in the Cloud, unified tables of the data are being created using BigQuery, to create a central and cohesive structure within the cloud environment. This includes processes such as data cleansing, normalization, enrichment, and deep understanding of the business logic.
The Benefits of this Solution
With the new infrastructure in place, the Raven team was prepared to analyze the data and visualize the product’s value through its usage. They utilized this data to implement prediction and classification models, embedding the outputs directly into their product.
Additionally, the Raven team was also able to achieve the following:
- Provide an essential tool to enhance the organization’s sales efforts.
- Create demos for future sales utilizing data from other customers.
- Incorporate sample data from prospects into the established infrastructure, allowing for the demonstration of the current state and forecasting improvements in retailer performance post-implementation.
- Enhance customer satisfaction by showcasing performance improvements.
- Implement internal data monetization, integrating data to create additional product features. This includes features such as:
- Next Best Offer, which considers not only the retailer’s data but also all purchases made with the product across its user base.
- User segmentation for targeted marketing efforts based on shopper behavior, analyzing data from all product usage.
- Providing retailers with a tool to track user activity patterns.
Exploring Further Possibilities
Further possibilities with this solution include creating a predictive analytics layer atop the existing framework, identifying key customers, emphasizing product features indicative of purchase intent, analyzing in-store shopper behavior for brick-and-mortar establishments, and enhancing and establishing Business Intelligence (BI) capabilities.
Raven offers a range of solutions tailored for retail tech companies, covering both e-commerce innovations like AR and video platforms and brick-and-mortar advancements such as smart carts. Their customized solutions help retail tech companies demonstrate value and ROI by organizing and clarifying their complex data environments. By tailoring their approach to the specific needs of each company, Raven ensures they deliver effective and targeted solutions.
Can't miss insights
Minimize the firefighting. Maximize ROI on pipelines.