Data transformation is an essential process for organizations to gain valuable insights from their data and make it actionable in real-time. The ETL process works in 3 steps including extracting data from multiple sources, transforming it into a standardized format, and loading it into a target database.
The ETL transformation stage is particularly important in ensuring data quality and consistency. There are various types of ELT (extract load transform) and ETL transformation types that organizations can use to achieve their data transformation goals.
In this article, we will explore all the different data transformation techniques and provide examples, helping you make the right decision when choosing the most suitable transformation technique for your organization.
What Is ETL Data Transformation
ETL transformation is the core stage within the Extract, Transform, Load (ETL) process, focused on cleaning, restructuring, and enriching data for analysis. This involves applying a set of predefined rules and algorithms to modify the data from its source format into a usable format for the target destination.
The Transform phase is a crucial step in the ETL process. The transformation process involves tasks such as data type conversions, data aggregation, filtering, sorting, and joining to ensure data is prepared for effective analysis and decision-making.
Your aim should be transforming the source data into a format that is suitable for your target destination. By using data transformation in ETL process techniques organizations can get insights from their data, allowing them to make data-driven decisions.
By using ETL transformation tools effectively, organizations can transform their data into a format that is easier to analyze, giving them a competitive edge in today’s data-driven world.
Criticality of ETL Transformation
Inaccurate or inconsistent data can lead to flawed decision-making, negatively affecting businesses. By effectively using ETL transformation tools, you can ensure that your data is reliable, enabling you to make informed decisions that can improve your business performance.
Besides helping businesses make better decisions, the main reasons why ETL is important for businesses are the following:
- Improved data quality: ETL ensures that data is consistent, accurate, and up-to-date, which is critical for businesses that rely on data to make decisions.
- Faster reporting: By automating the process of extracting, transforming, and loading data, ETL can significantly reduce the time it takes to generate reports. So your organization will be able to respond to changing market conditions more quickly by acting in real-time on accurate data.
- Cost savings: It can help businesses to reduce the costs associated with manual data integration and reporting. By automating these processes, you can free up the staff to focus on higher-value tasks.
Types of ETL Transformation
There are 9 ETL transformation types that businesses can use to streamline their data management processes. Let’s look at each type in more detail with examples.
1. Bucketing/Binning
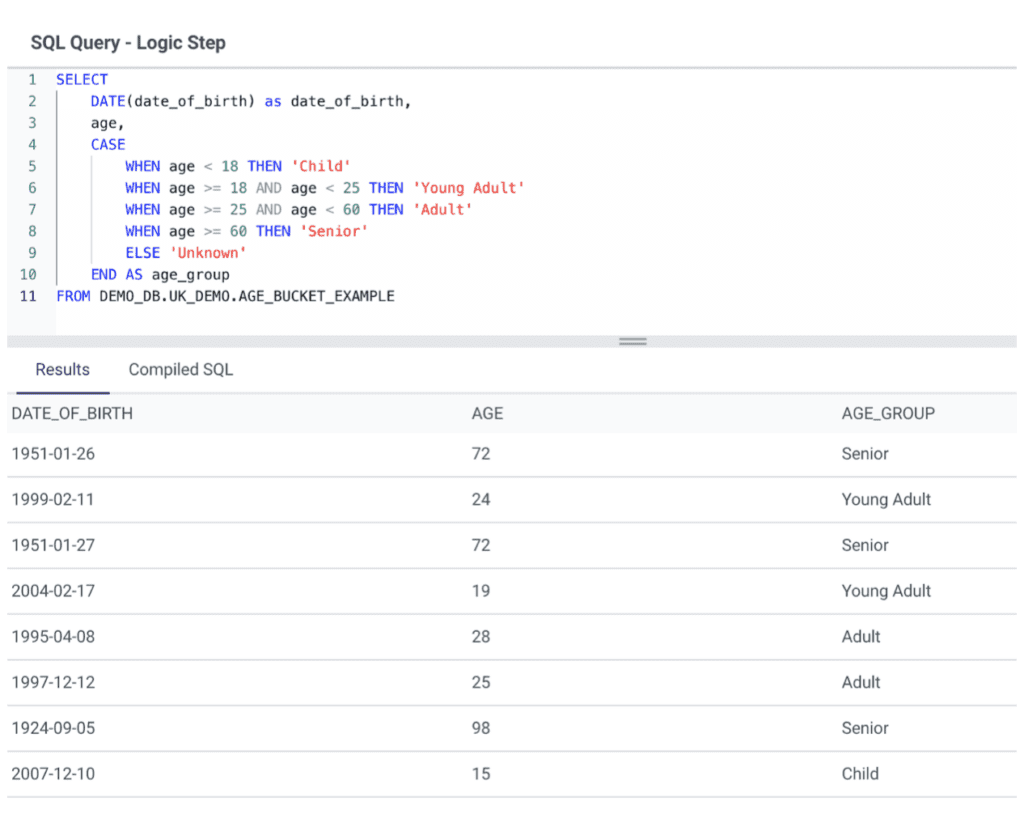
This technique divides a continuous variable into smaller groups or intervals known as buckets or bins. Organizations use it to analyze data from surveys, questionnaires, or other sources where there are a large number of responses. It is useful in reducing the impact of outliers and ensuring that the data is manageable and more straightforward to analyze.
Use case
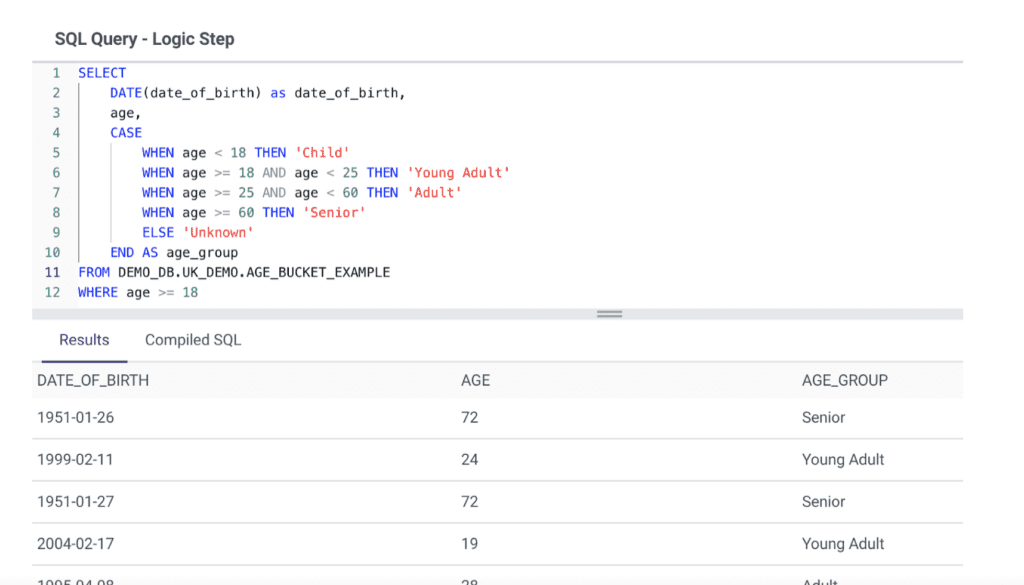
If we run a survey asking for the respondent’s date of birth, we may want to bucket the answers by age group to simplify the analysis.
Example
2. Data Aggregation
Data aggregation combines data from multiple sources into a single, cohesive dataset. The technique is useful when working with large datasets that contain similar data in different formats or when consolidating data from various departments within an organization. The e-commerce industry can benefit the most from data aggregation since these companies have a strong command of data excel in their niche.
Use case
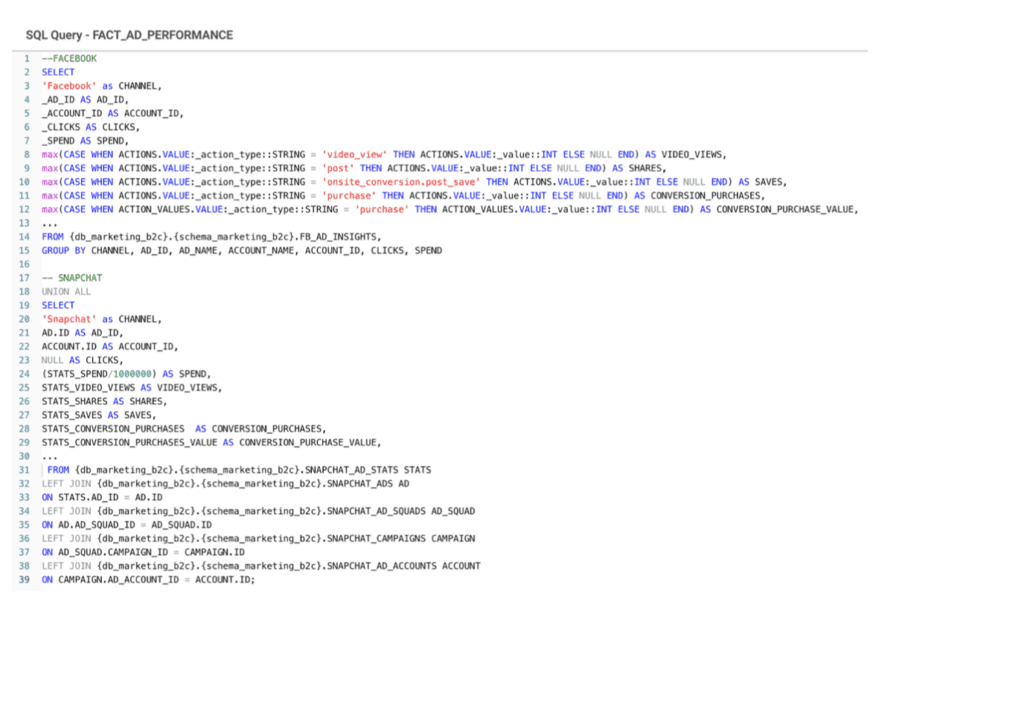
For example, we may want to cross data between Facebook Ads and Snapchat Ads. To do so, we first ingest data from both platforms, but then we would like to join the data into a single dataset in order to run efficient marketing campaign analysis
Example
This is an example of how we could aggregate data from two marketing sources. The full data model and complete query can be found in our Marketing B2C Analytics kit
3. Data Cleansing
This tool identifies and eliminates errors and inconsistencies in data. Data cleansing involves data profiling, which entails analyzing the data to identify errors, and data validation, which entails verifying that the data meets predefined business rules and standards.
Use case
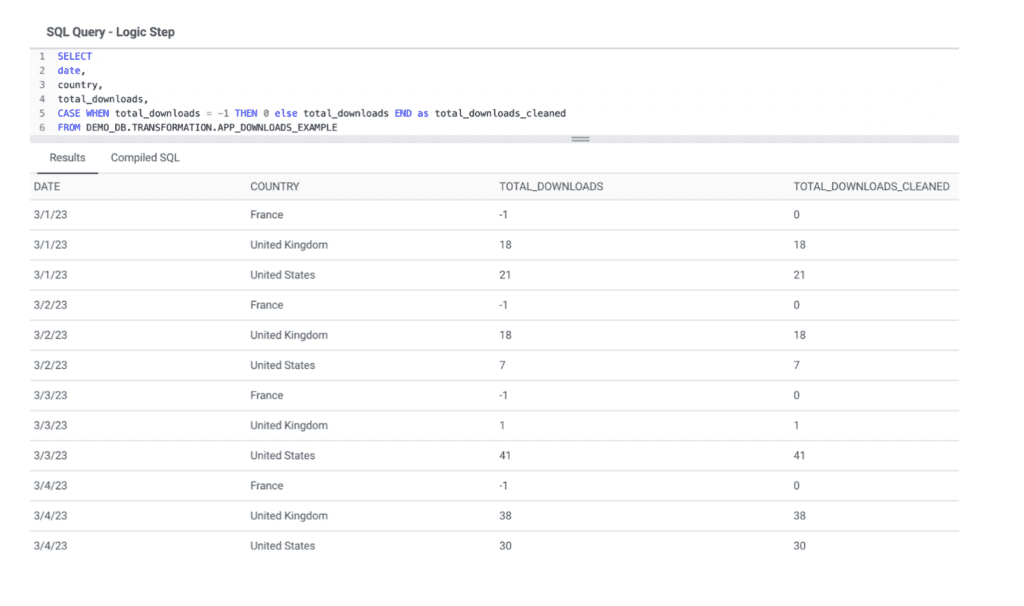
In this scenario, we connect to an API in order to retrieve analytics data about our mobile app usage. However, we notice negative values in the data. After investigating, the API returns a “-” for null values, that is then saved as “-1” in our data warehouse. In order to cleanse this data, we will replace “-1” values by “0”
Example
4. Data Deduplication
This ETL transformation technique can identify and remove duplicate data within a dataset. Besides identifying duplicate records, it selects the most recent or complete record to retain. It helps businesses in lowering storage costs and optimizing free space. Data deduplication is most useful in virtual environments using multiple virtual machines for app deployments and test/dev.
Use case
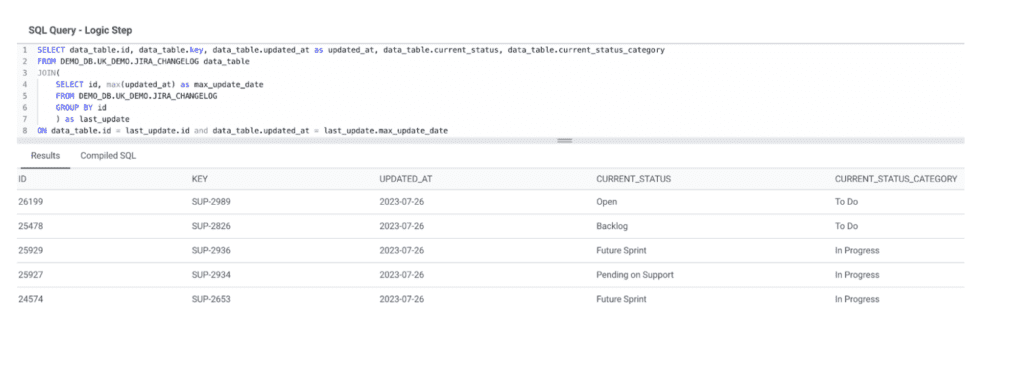
We store our JIRA Changelog to run analysis on how tickets and issues are processed. For each Support ticket, we can see the change and the date associated so we have as many rows as times the ticket was updated. However, in this situation, we want to see only the latest status of the ticket: we need to deduplicate the data and keep only the latest row per ticket.
To do so, we make a first query to select the ID and last update date using a MAX function, then we use a join to get the data needed.
Example
5. Data Derivation
Data derivation creates new data elements based on existing data by using mathematical, logical, or other functions to transform it into a new format. It enhances the value of the data by providing additional metrics. This is one of the best types of data transformation for the retail industry since it helps better understand the customers’ buying patterns.
Use case
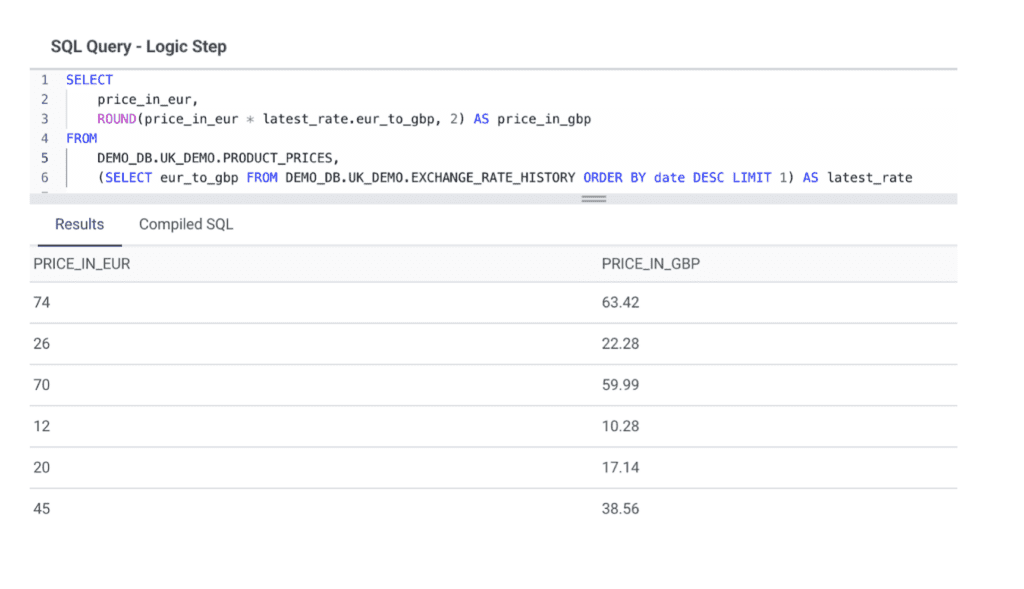
Let’s say we have a table with prices in Euro, and a table with the exchange rate between Euro and British Pound Sterling. We can use data derivation to compute the price value in British Pound, using the latest change rate.
Example
6. Data Filtering
This technique helps you remove unwanted data from a dataset. It chooses specific data elements based on predefined criteria and excludes others. This ELT transformation type is beneficial for IT professionals to finish various requirements in terms of data examination.
Use case
Let’s take our first survey example. If we want to filter the data to exclude answers provided by children, we can easily do so by using a WHERE clause and adding the condition that the age must be over 18
Example
7. Data Integration
This is one of the best ETL transformation tools to help you map data elements from different sources into one dataset, providing a holistic view of the data. The manufacturing industry uses this technique to integrate data from different customer service channels to provide a unified customer experience.
Use case
We have 3 different suppliers for car engines. Each provide their pricing, but they don’t use the same name for the same product category “Diesel Engine”. With Data Integration transformation in ETL, we can use a mapping table to standardize the product category name and make sure we can use a single dataset to analyze data from multiple sources
This is our mapping table:

And here is how to integrate this standardized name in our dataset using a JOIN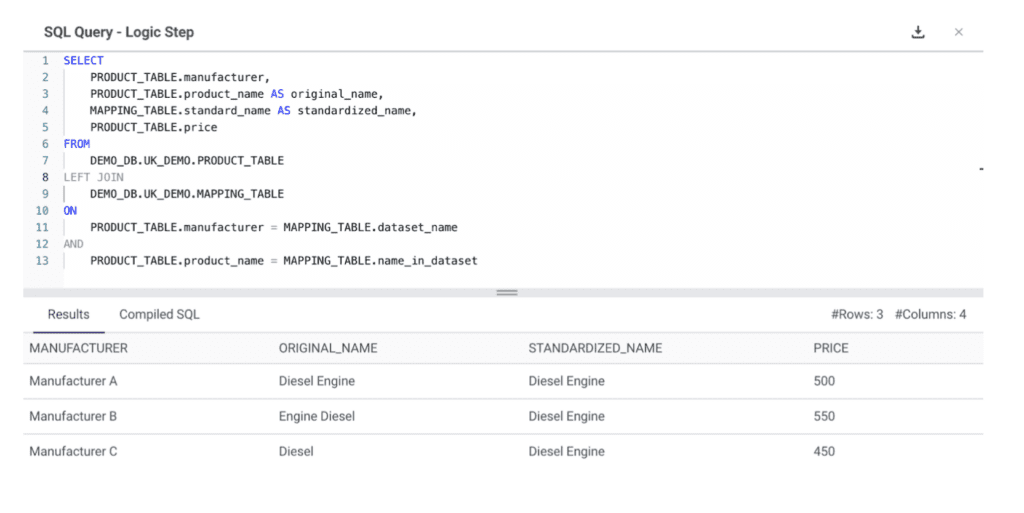
8. Data Joining
It combines data from different datasets based on a matching key, such as a customer ID or a product code. This ELT transformation type will help you get more comprehensive insights and improve data quality.
Use case
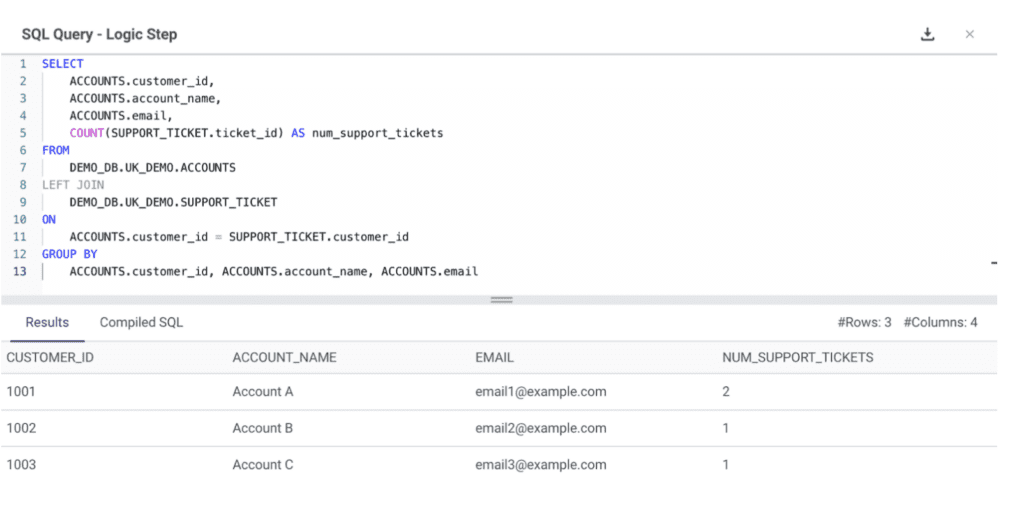
Let’s say we have one table with the list of support tickets open and a customer ID associated with it, and other table with the accounts data. We can join the two tables together using the customer_id to retrieve the number of tickets per account and the account main contact, in order to contact them and prioritize which account needs more support.
Example
9. Data Splitting
Data splitting divides a dataset into smaller subsets based on your criteria, allowing you to improve data processing efficiency and make targeted analyses. Data splitting is crucial for ensuring the accuracy of data processes that use data models, such as machine learning.
Use case
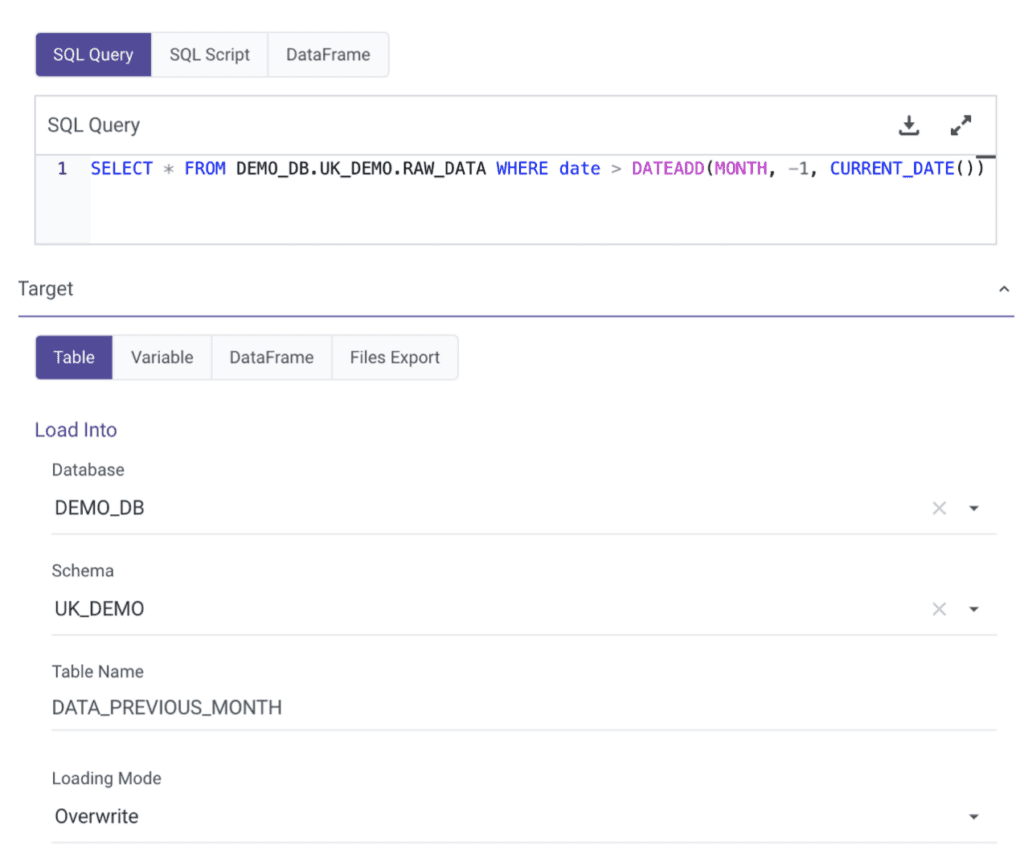
When a data vendor provides the entirety of the dataset on a regular basis, we may want to split the data in a subset in order to get only the last month of data. This last month of data can be stored separately to make faster queries and improve data processing efficiency.
Example
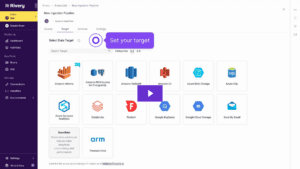
In Rivery, here is how we would split such dataset, and directly load the queried data into a separate table:
ETL Transformation Challenges
You can see that ETL transformation is a powerful tool for data management, but it does come with some challenges:
- The complexity of data integration: As data may be sourced from different systems and formats, it will require significant data mapping and transformation.
- Compromise of data quality: During the transformation process, the data quality can be compromised, leading to inaccurate or incomplete data.
- Scalability of ETL transformation: You may need significant computational resources and time to process large datasets.
To overcome these challenges, you need to carefully plan, monitor, and implement ETL processes to ensure that data is accurate and secure.
The Data Transformation Process
The data transformation process is an essential component of the ETL. The transformation process includes several sub-processes, such as:
- data cleaning
- data integration
- data validation
- data enrichment
The data transformation process starts with data profiling, which involves analyzing the source data to understand its structure, quality, and completeness. Once the data has been profiled, data mapping and transformation rules are defined to convert the data into a common format that can be easily analyzed and interpreted.
Data quality checks are performed throughout the transformation process to ensure that the data is accurate, complete, and consistent. The transformed data is then loaded into a target system, such as a business intelligence tool, where it can be analyzed and used to make decisions.
How Rivery Can Help
Rivery makes it simple to quickly create complex end-to-end ELT data pipelines using no-code or custom code. Using SQL or Python, you can convert raw data into business data models. With Rivery, you can perform various transformations within your warehouse or cloud, having full control over any process. Our SQL transformations use an ELT-push down approach, providing you with improved scalability, ease of use, and more informative insights.
Contact us for more information!
Minimize the firefighting. Maximize ROI on pipelines.


