


How to Build A Modern Data Stack

In this article, we’ll discuss the concept of modern data stacks, what it takes to build one, and the analytic capabilities that come with it.
Introduction to Modern Data Stacks
A modern data stack is a group of complex tools and cloud technologies built to gather, store, process, and analyze data. Businesses should use a modern data stacking system with critical data sources, extract and load tools, and transformational and analytic tools.
Creating a modern data stack can be a wise solution if correctly approached. The benefits include scalability, variety, flexibility, real-time processing, and data governance.
Key Components of Modern Data Stack
Before building a modern data stack, you must understand its complexity and the layers behind it. A modern data stack includes interconnected components working together to ingest, process, store, analyze, and visualize data.
Here are the main components of a modern data-stacking solution:
- Data Warehouses: Central repositories optimized for storing structured, cleaned, and processed data for analytics and reporting.
- Data Integration Tools: Facilitate the extraction, transformation, and loading (ETL) or extraction, loading, and transformation (ELT) of data from various sources into a centralized data repository.
- Business Intelligence (BI) Tools: Enable users to query, analyze, and visualize data to derive insights and make data-driven decisions.
- Data Transformation Tools: Enable data engineers and analysts to clean, enrich, and transform data for analysis and visualization.
- Data Orchestration and Workflow Management Tools: Automate and schedule data workflows, manage dependencies, and monitor job executions to ensure the smooth operation of data pipelines.
Data Storage Layer
The data storage layer is responsible for storing and managing data. It’s a critical interface between the application and the physical storage devices where the data is stored. You may use a centralized solution like a data warehouse, which gathers data from multiple sources and facilitates comprehensive analysis. You can also feed your data into a data lake, such as Snowflake, which focuses on huge quantities of unstructured data.
If you want the best of both worlds, you could use Databricks—a data lakehouse platform enabled by a new, open system design.
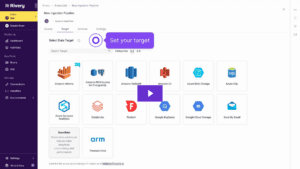
Data Ingestion Layer
Data ingestion (also known as cloud data replication or extract and load), is the process of extracting data from a data source (i.e. database, SaaS application, files, etc.) and loading it into a target data lake or data warehouse. The ingestion process can be executed in batch, real-time or stream processing. Once data is ingested into your target lake or warehouse, you need to transform it to match the desired business logic and serve it to the consumption layer or directly to users.
Regarding data ingestion methods, the two standard ones you can come across are batch and real-time data ingestion. However, micro-batching is another method that has become popular recently. Here is the exact meaning behind these data ingestion methods:
- Batch data processing – The data is imported in batches at a regular schedule or interval. For example, a company can have batch data ingestion once per day, enough for their daily reports to be created.
- Real-time data processing – The data is imported as it is created or emitted by the source. That means data could be added to the warehouse constantly and streamed as the company or customer needs.
- Micro batching – The data is imported in small batches, which are more frequent than the batches from the regular batch data processing method. This is the processing method used by most streaming systems.
Several data ingestion tools exist and are used, but the most popular are:
SAAS tools – these include Stitch, Fivetran, Rivery, Hevo Data, etc.
Open-source tools – including StreamSets, Airbyte, and Singer.
Custom data ingestion tools – are built on orchestration engines, and a common option for this is Airflow.
Rivery can ingest data from any source via no-code pre-built integrations or custom connection integration. This ingestion isn’t only to bring SaaS apps, databases, or file data into a lake or warehouse but also back into business applications via Reverse ETL. From there, Rivery allows you to transform your data using SQL or Python inside the platform, or by leveraging a data transformation tool like dbt. Whether you build your transformations inside Rivery or with other solutions, Rivery helps with orchestrating data pipelines and seamlessly connects your ingestions, transformations, and even data activation into a single flow.
Another option is Matillion, delivering near-real-time CDC (Change Data Capture) extraction and operational loading. Airbyte is also an option for a versatile interface that handles massive data volumes.
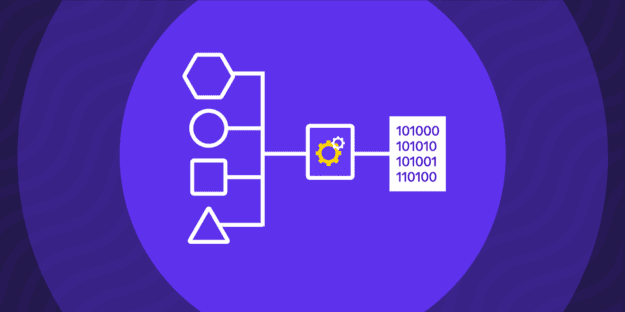
Data Transformation Layer
Data transformation refers to the process of converting data from one format or structure into another, making it suitable for analysis, reporting, or other purposes. It involves cleaning, aggregating, and manipulating raw data to extract meaningful insights. Data transformation is crucial because raw data often contains errors, inconsistencies, or is in a format unsuitable for analysis. By transforming data, organizations can make informed decisions, identify patterns, and gain valuable insights from their data.
One of the most popular data transformation tools out there to use is dbt, a SQL-first transformation workflow that lets teams quickly and collaboratively deploy analytics code following software engineering best practices.
Rivery, allows you to transform your data using SQL or Python inside the platform, with Rivery you can bring your own Python scripts to augment prep for data modeling SQL transformation. In particular, Rivery integrates seamlessly with DBT, allowing organizations to leverage powerful data modeling capabilities alongside data integration workflows. With over 200 native connectors, Rivery streamlines your data transformation processes.
Data Orchestration Layer
Data orchestration is the process of designing, implementing, and managing workflows and data pipelines to ensure seamless integration, transformation, and analysis of data from multiple sources. It involves organizing and coordinating data-related tasks to optimize data processing and enhance overall data management efficiency.
Rivery allows you to orchestrate data pipelines intuitively and eliminates infrastructure and code overhead to scale your ELT data pipelines faster. Rivery’s Orchestration provides support for branching, multi-step processes, conditional logic, loops, and other features, making it easy to design complex workflows.
If you require an open-source data integration solution, Airflow could be a good option to streamline tasks and encourage data transfers. The platform uses connectors and supports scheme management, intuitive mentoring capabilities, and incremental data sync. Another option is Dagster, an orchestrated platform with a developer-first experience approach, fully serverless or hybrid deployments, and CI/CD. Mage is also an AI-powered platform that lets you run, monitor, and orchestrate thousands of pipelines.
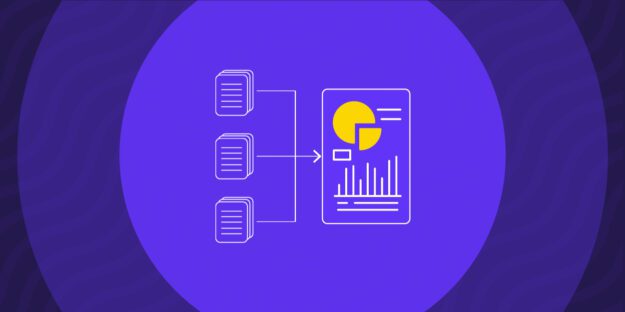
Data Visualization Layer
Your data is useless if you can’t interpret it, meaning you need a data visualization layer. Data Visualization also known as Business Intelligence (BI), is the visual representation of data and information. Data is visualized via elements such as charts, graphs, maps, and dashboards to visualize data insights and patterns that emerge over time. Basically, it is a way to present complex data in a clear, concise and understandable manner for everyone to understand.
Some of the most popular data visualization tools are Tableau, Sigma, Power BI, Looker and Omni.
Sigma is a suitable option for data visualization. It establishes an efficient connection to your data warehouse and enables real-time data representation. Other popular data visualization tools are Tableau, Power BI, Looker and Omni.
Data Catalog Layer
A data catalog serves as a central repository of accurate information, empowering both data creators and users to locate, oversee, and regulate data access throughout your organization’s data landscape. It empowers every stakeholder, from data architects to operational teams, to effortlessly craft, disseminate, document, discover, retrieve, and analyze data, regardless of its whereabouts within the organizational framework.
Three of the best options on the market for data catalogs are Alation, Atlan and Collibra.
Data Observability Layer
If you have inaccurate data, you might as well have no data because it won’t help your business. Data observability, a term coined by Monte Carlo Data is a proactive way to alert data teams of bad data before it hits production pipelines. By performing automated data quality checks, it ensures that your team is the first to know when data breaks, ensuring your organization always has reliable data.
The premier choice for data observability is Monte Carlo, an end-to-end solution for your data stack that monitors and alerts for data issues across your data warehouses, data lakes, ETL, and business intelligence. The platform uses machine learning to infer and learn your data, proactively identify data issues, assess its impact, and notify those who need to know.
In addition, Metaplane is another suitable alternative for data observability. It continuously monitors the data flowing through your data stack then alerts you when something may be going wrong. The platform does this by collecting metrics, metadata, lineage, and logs, training anomaly detection models on historical values, then sending you alerts for outliers with options to provide model feedback.
Reverse ETL Layer
In reverse ETL, data is extracted from the data warehouse, transformed inside the warehouse to meet the data formatting requirements of the third party system, and then loaded into the third party system for action taking since data warehouses cannot load data directly into a third party system.
The data must first be transformed to meet the formatting requirements of the third party system. However, this process is not traditional ETL, because data transformation is performed inside the data warehouse. There is no “in-between” processing server that transforms the data.
Here’s an example: If a Tableau report contains a customer lifetime value (LTV) score, this Tableau-formatted data is not processable in Salesforce. So a data engineer applies an SQL-based transformation to this report data within Snowflake to isolate the LTV score, format it for Salesforce, and push it into a Salesforce field so sales representatives can use the information.
Rivery’s Reverse ETL lets you prep data in your warehouse and push the data insights back into any app your organization relies on – in a single workflow.
Showing the Value of Your Modern Data Stack
You’ll need a significant investment to build a modern data stack; understandably, it isn’t always a simple choice. That said, the value of a modern data stack is enormous, even if it’s challenging to predict the ROI.
If you’ve decided to build a modern data stack, you should conduct research beforehand. A modern data stack must meet current tech standards and offer upgrade capabilities for upcoming technologies and frameworks.
Creating a modern data stack now will likely help your business for decades to come if you employ the right approach.

Minimize the firefighting. Maximize ROI on pipelines.