


Bento Insights – Sales Analytics Platform for SaaS B2B Companies

Last published
2023-02-01
By Vision BI
Categories
Sales Crm
Type
Data Model
Integrates with


By Vision BI
ahoy
FEB 1, 2023 ahoy
FEB 1, 2023Empower your management team with predefined dashboards that track every KPI you need to grow. This Kit allows you to get a complete view of your business performance.
Manage the entire sales cycle with funnel analysis by geography, team, and employee. Monitor your sales pipeline with cohort analysis, and lead conversion/win rates throughout the funnel.
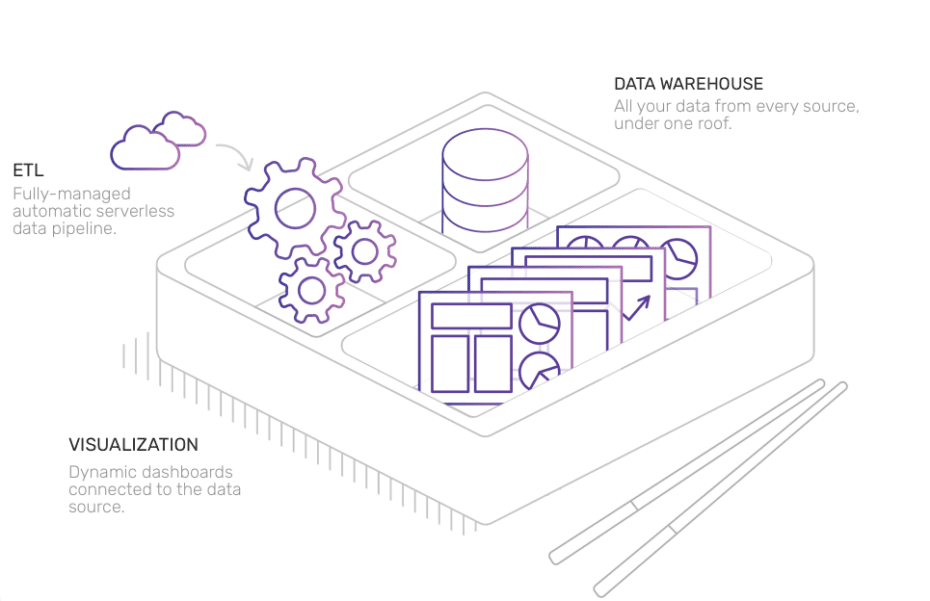
Bento is an out-of-the-box analytics platform for SaaS B2B companies. From Marketing to Sales to Product to Support, Bento connects all the dots.
- Predefined dashboards for every business team
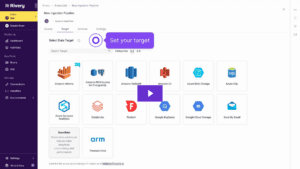
- OOTB ELT’s ready to use
- OOTB DWH & Data models
Bento’s architecture is based on Rivery for data ingestion and transformation (ELT), Snowflake as a data warehouse, and Tableau for data visualization.
Sales Dashboard Content
Sales Overview Dashboard: Understand the performance of your entire Sales organization.
KPIs
- Number of new opportunities compared to the previous period
- Number of potential customers and ARR amount
- Number of new customers and ARR amount compared to the previous period
- Expected APP amount
- Customer Journey
- Get to know how many leads turn into an opportunity and become closed won.
- Conversion rate and the average time period in a specific stage
- New Opportunities Vs. Closed Won
- With a nice Kohort chart, know how many months pass till opportunity turns to WON.
- New ARR Over Time
- Present the amount of new ARR per month in comparison to the target value.
- New Opportunities by Country
- Number of new opportunities by country presented on a world map graph.
- New Opportunities by Industry
- Number of new opportunities by Industry presented on a tree map graph.
- Salesperson by Won Opportunities & ARR
- Understand a salesperson’s efficiency by the correlation between won ARR and the number of opportunities won.
- Snapshot pipeline: this enables you to freeze the pipeline on a quarterly/monthly basis
Salesperson Scorecard: Understand your individual salesperson performance.
KPIs
- Total ARR
- Number of new opportunities compared to the previous period
- Number of new customers compared to the previous period
- Number of new ARR compared to the previous period
- The amount of sales velocity compared to the previous period
- Opportunity Conversion Rate
- Opportunities closed per month
- Salesperson’s average conversion rate with a comparison to the target
- ARR Vs. Team Avg
- Salesperson’s ARR amount per month compared to team performance
- Activity Type
- Salesperson activities split by type
- Opportunity Details
- Salesperson’s list of opportunities