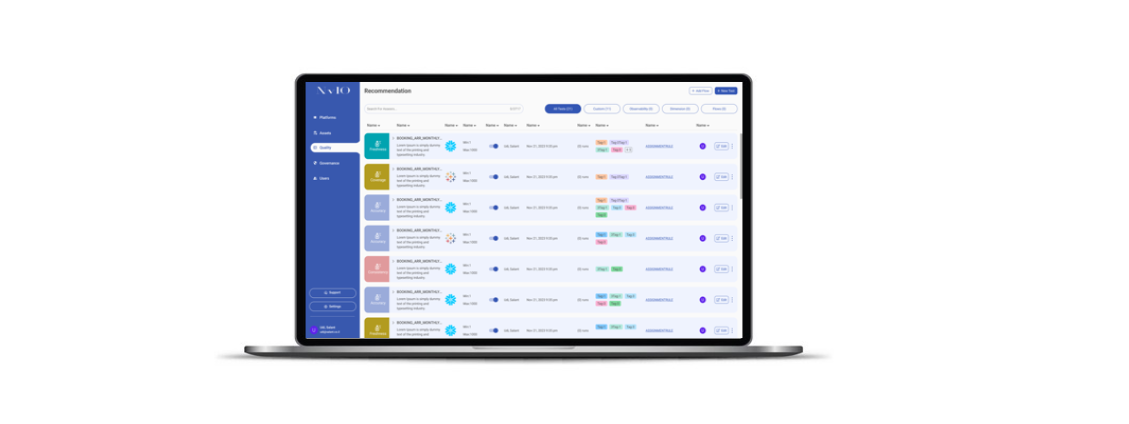


Panintelligence Marketing Visualization

Last published
2022-07-08
Categories
Intelligence Analytics
Type
Data Model
Integrates with


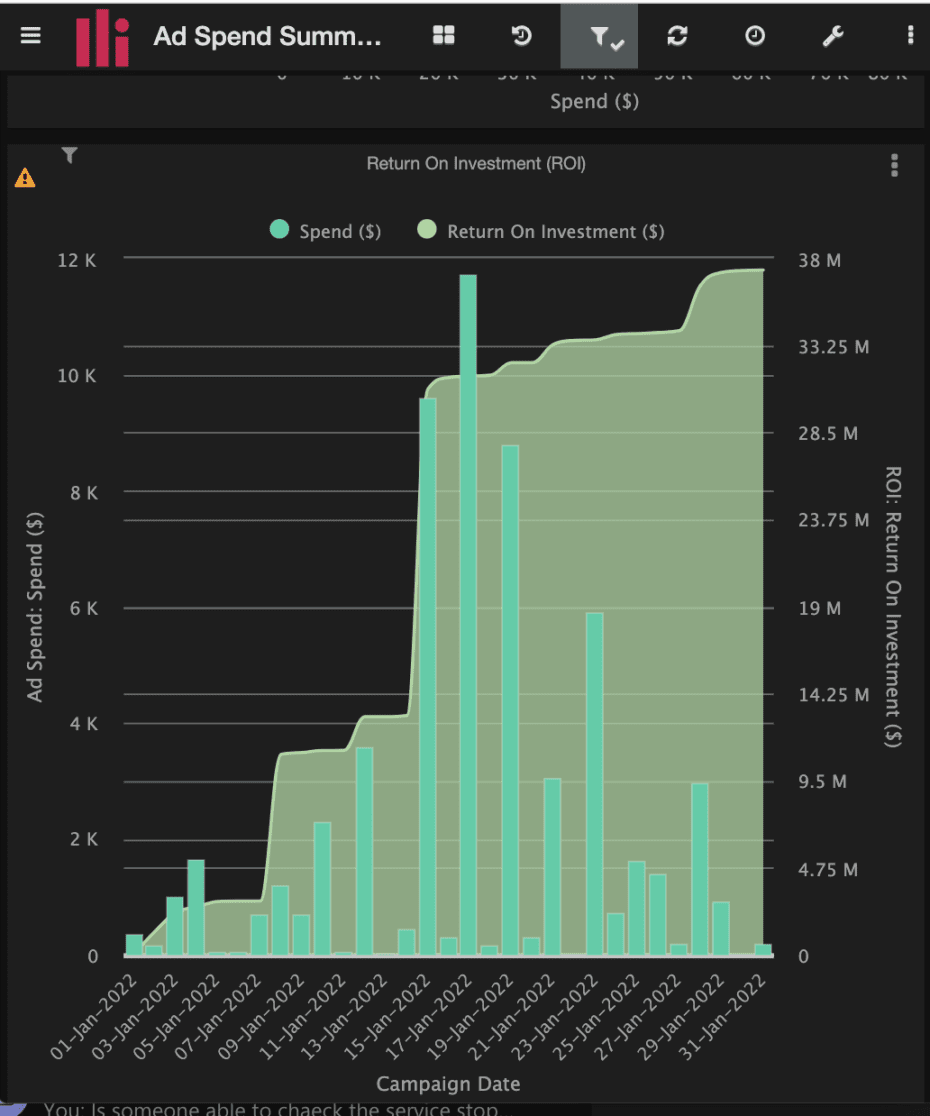
This Kit allows you to visualize all of your advertising data in one place for real time performance management for you and your clients by giving a complete overview of campaign metrics and ROI. Data is queried from any combination of the below advertising and communication sources to populate the live dashboards and reports supplying campaign analysis and performance tracking, all in one place, with real-time insights.
- Facebook Ads
- Snapchat Marketing
- Twitter Ads
- TikTok
- LinkedIn Ads
- Bing Ads
This Kit includes…
Data ingestion from the following ource entities:
- Facebook Ads
- Snapchat Marketing
- Twitter Ads
- TikTok
- Bing Ads
- Ad Performance
- Budget Summary
- In order for this report to successfully run, you need to select at least one Account in the Account source-level filter within the “Bing Ads – Report Entities” river.
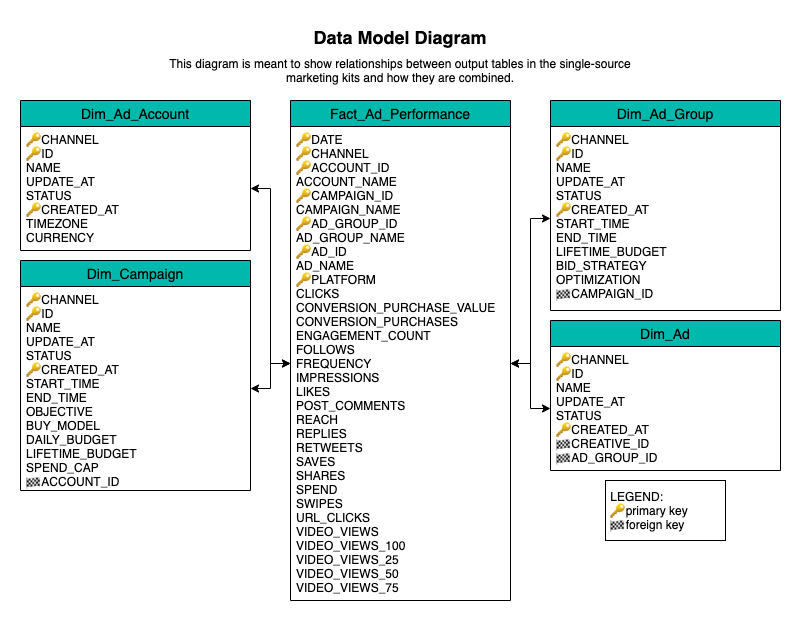
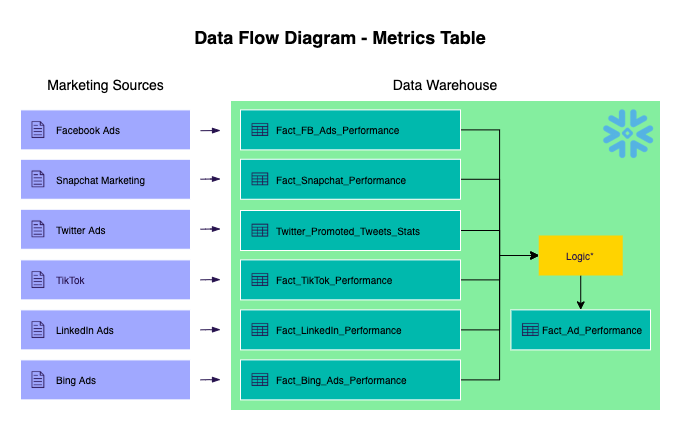
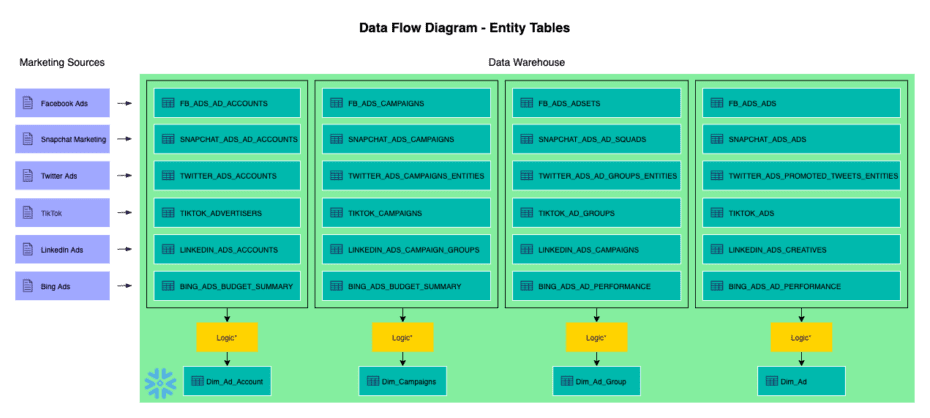
A master logic river that orchestrates the transformation of all the marketing data from the sources within the Snowflake data warehouse to an all encompassing data model which allows for cross-channel analytics.
The minimum RPU consumption will be based on how many of the sources are used in the analysis and how much data is being pulled from the endpoint. Consult the Rivery Pricing Documentation for more information.
Configuring this Kit for use
Variables
In this Kit, there are three variables that are used to make for dynamic use of target configuration.
- {Database_Marketing} is used in all Target configurations and queries as the target database name.
- {Schema_Marketing} is used in all Target configurations and queries as the target schema name.
- {PM_Alert_Group} is used as the alert email address(es) for when a river fails (optional).
Go to the Variables menu on the left side navigation bar and create the global variables for Database_Marketing, Schema_Marketing, and PM_Alert_Group. Fill in the values as the Snowflake database and schema where you would like the data to land and the email address(es) to which you would like the failure emails sent.
Directions
Here are step-by-step instructions on how to use the Panintelligence Marketing Visualization Kit and connect it to your Panintelligence account.
- Add the above variables to your Rivery account’s global variable list
- Within the ‘Panintelligence Marketing Data – Logic’ river, toggle off the containers for which you do not have source Kits (ex: if you do not use the Facebook Ads source, select the enable/disable toggle within the Facebook Ads container)
- Run the ‘Panintelligence Marketing Data – Logic’ river
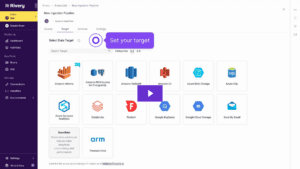
- Go to Panintelligence Partnership with Rivery and click ‘Find Out More’
- Follow directions to create an account (enter an email and password)
- Create an environment – Your own customer dashboard environment will be built in 5 minutes
- Login as rivery / rivery in your environment
- The data connections will be edited, but you’ll see a dashboard with default data
- Click the ‘wrench’ in the top right corner and select data connections
- Select Edit the Modular Marketing Data Connections
- Enter your snowflake details – exactly as you did in the Rivery console
- Save the data connection and click back into the dashboard
- Refresh the page and your data is displayed!
Connections
Kits are imported with ‘blank’ source and target connections. In order to use the kit, you have two options:
- Swap out blank connections with existing connections
- Add credentials to the blank connections that come with the imported Kit
Have questions about this Kit?
Set up a meeting with a Rivery solutions engineer.